> ## Documentation Index
> Fetch the complete documentation index at: https://docs.depict.ai/llms.txt
> Use this file to discover all available pages before exploring further.
# Collection analytics
> Per-collection performance: KPIs, conversion funnel, inventory risk, pinned-vs-auto health and benchmarking.
Every collection carries its own analytics, surfaced in three places: KPI
tiles above the collections table, performance columns in the table itself,
and a detailed analytics drawer per collection.
Unless you pick a custom range, metrics cover the **last 30 days compared to
the previous 30 days**.
## KPI row
Aggregated tiles across all collections: total revenue, total views, average
CTR, units sold, average STR, add-to-carts and dead stock risk. Every metric
label has a hover tooltip explaining exactly how it's computed. Clicking a
tile opens a **trend modal** with the metric charted over time (30d/7d/1d or a
custom range); the dead stock tile opens a searchable list of at-risk products
with CSV export.
## The analytics drawer
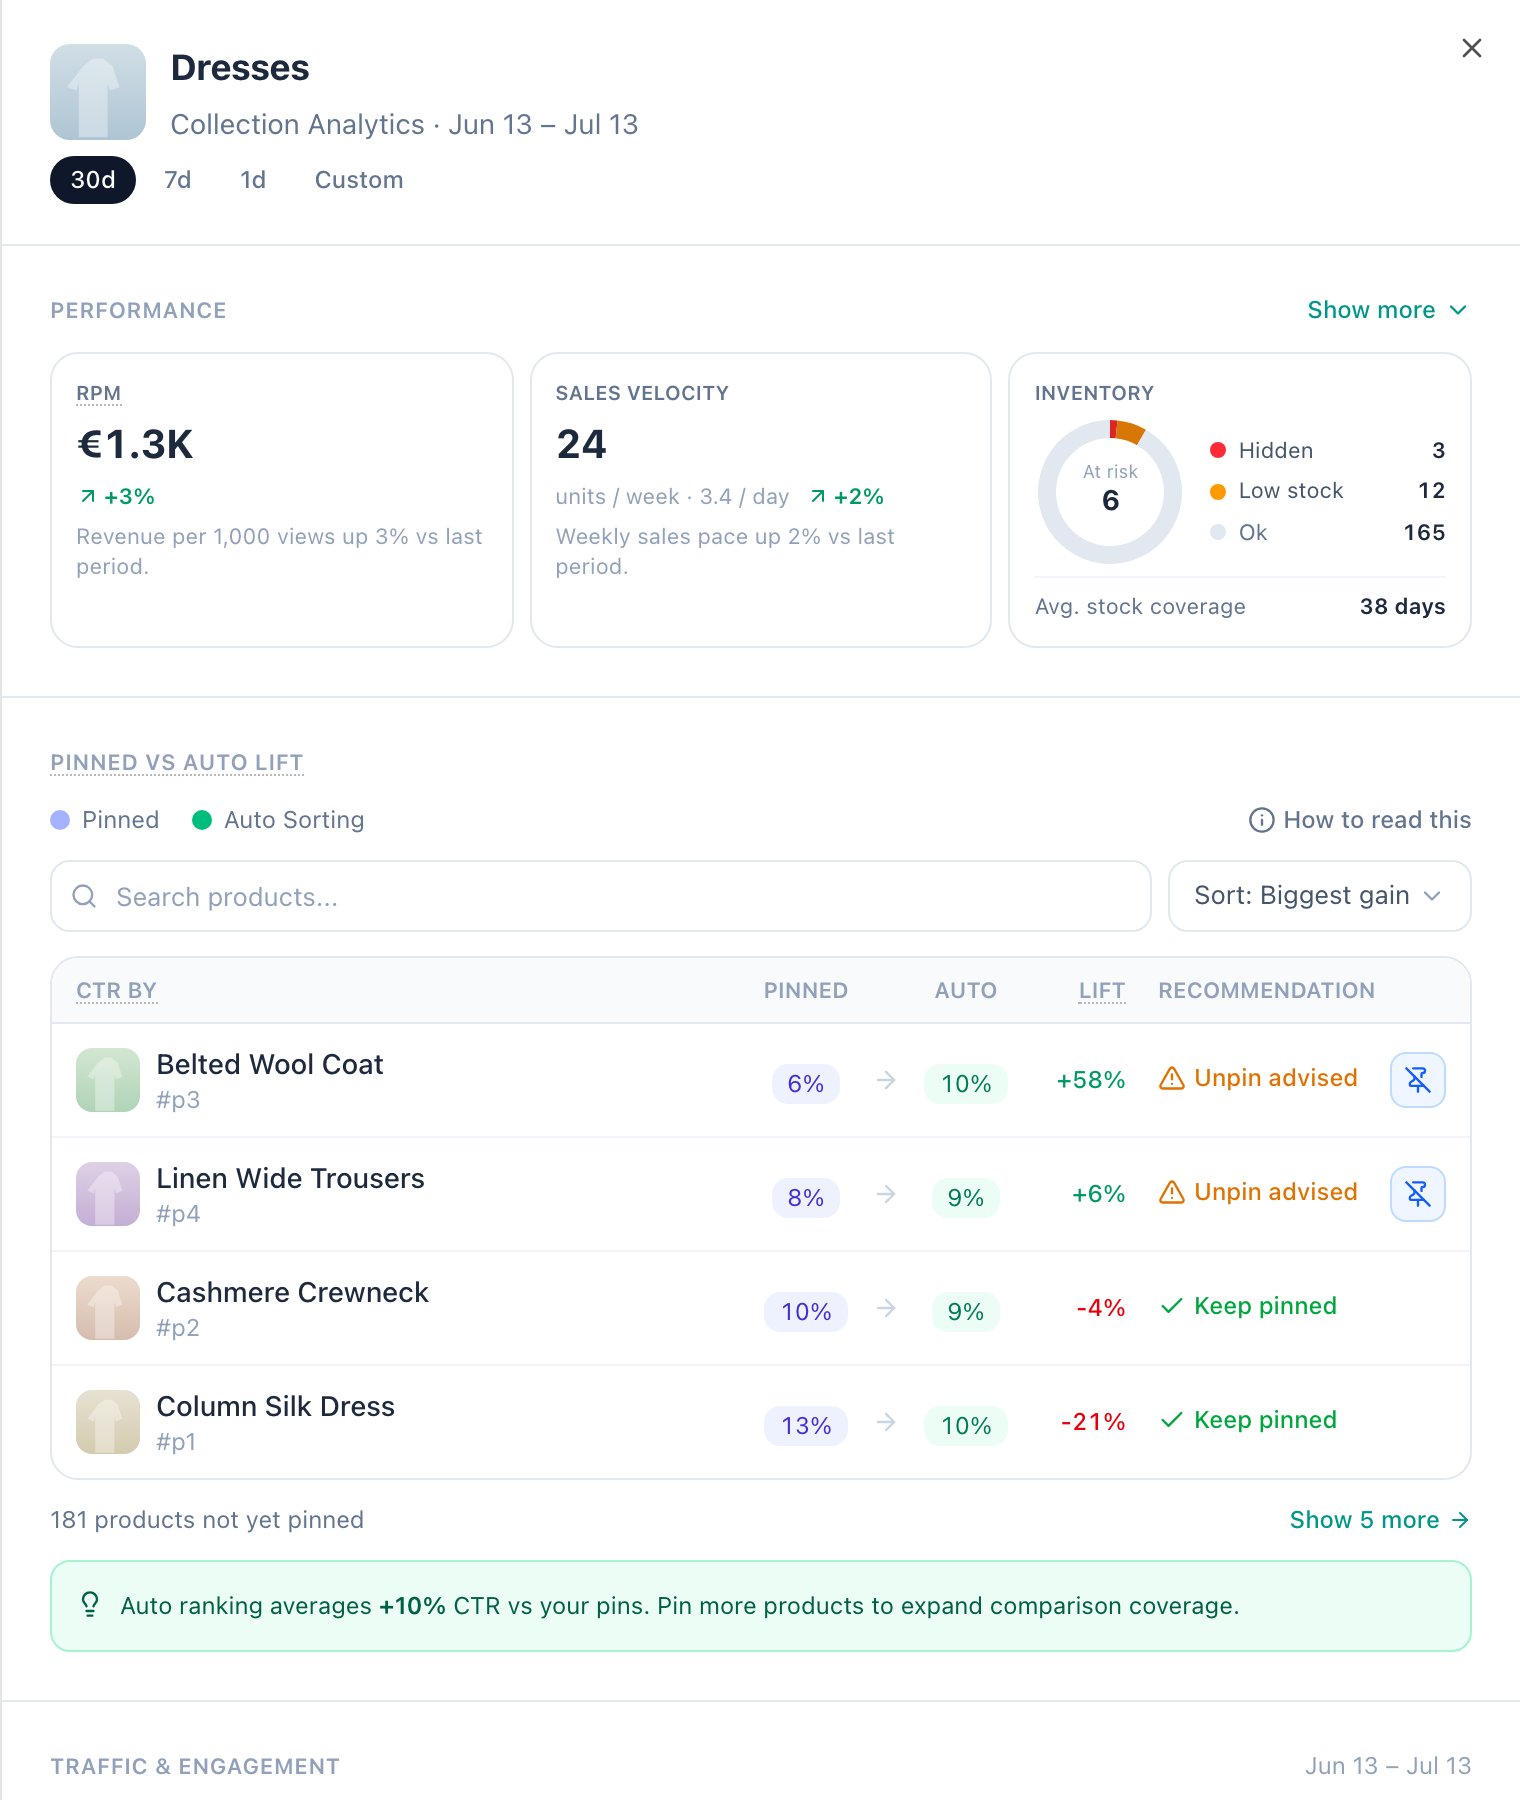
Open the drawer from a collection row's analytics button.
 ### Traffic & Engagement
A horizontal conversion funnel — impressions, clicks, add to cart (when
tracked) and purchases — with stage-to-stage conversion rates on the
connectors and previous-period trends under each stage. CTR is shown alongside
with its trend.
### Performance
Revenue, RPM (revenue per thousand impressions), views, CTR, units sold and
STR, each with previous-period deltas and clickable trend charts.
### Product health & inventory
* **Variant availability** — in-stock variants as a share of all variants in
the collection.
* **Inventory breakdown** — healthy / low / out-of-stock buckets, dead stock
count and average stock coverage in days.
### Top products
The best performers in the collection, with per-product CTR and STR.
## Pinned vs Auto
For collections with pinned products, Depict compares the CTR of your pinned
products against the auto-ranked ones and turns the result into a
recommendation:
* **Pins performing** — your pins outperform auto-ranking; leave them.
* **Check pins** — the difference is small or mixed; review individual pins.
* **Unpin advised** — auto-ranking outperforms your pins; consider unpinning.
The collections table shows this as a compact traffic-light status. The
drawer and the **Pinned vs Auto** modal break it down per product, with
relative CTR differences, per-product recommendations, one-click pin/unpin
actions and CSV export. An info tooltip explains how to read the numbers.
## Inventory and dead stock
**Dead stock** counts products with stock but effectively no sales in the
period — capital sitting still. **Average stock coverage** estimates how many
days current inventory lasts at the current sales rate. Both appear per
collection in the table (fused into one Inventory column) and aggregated in
the KPI row; the dead stock modal lists the specific products so you can act
on them.
## Benchmarking
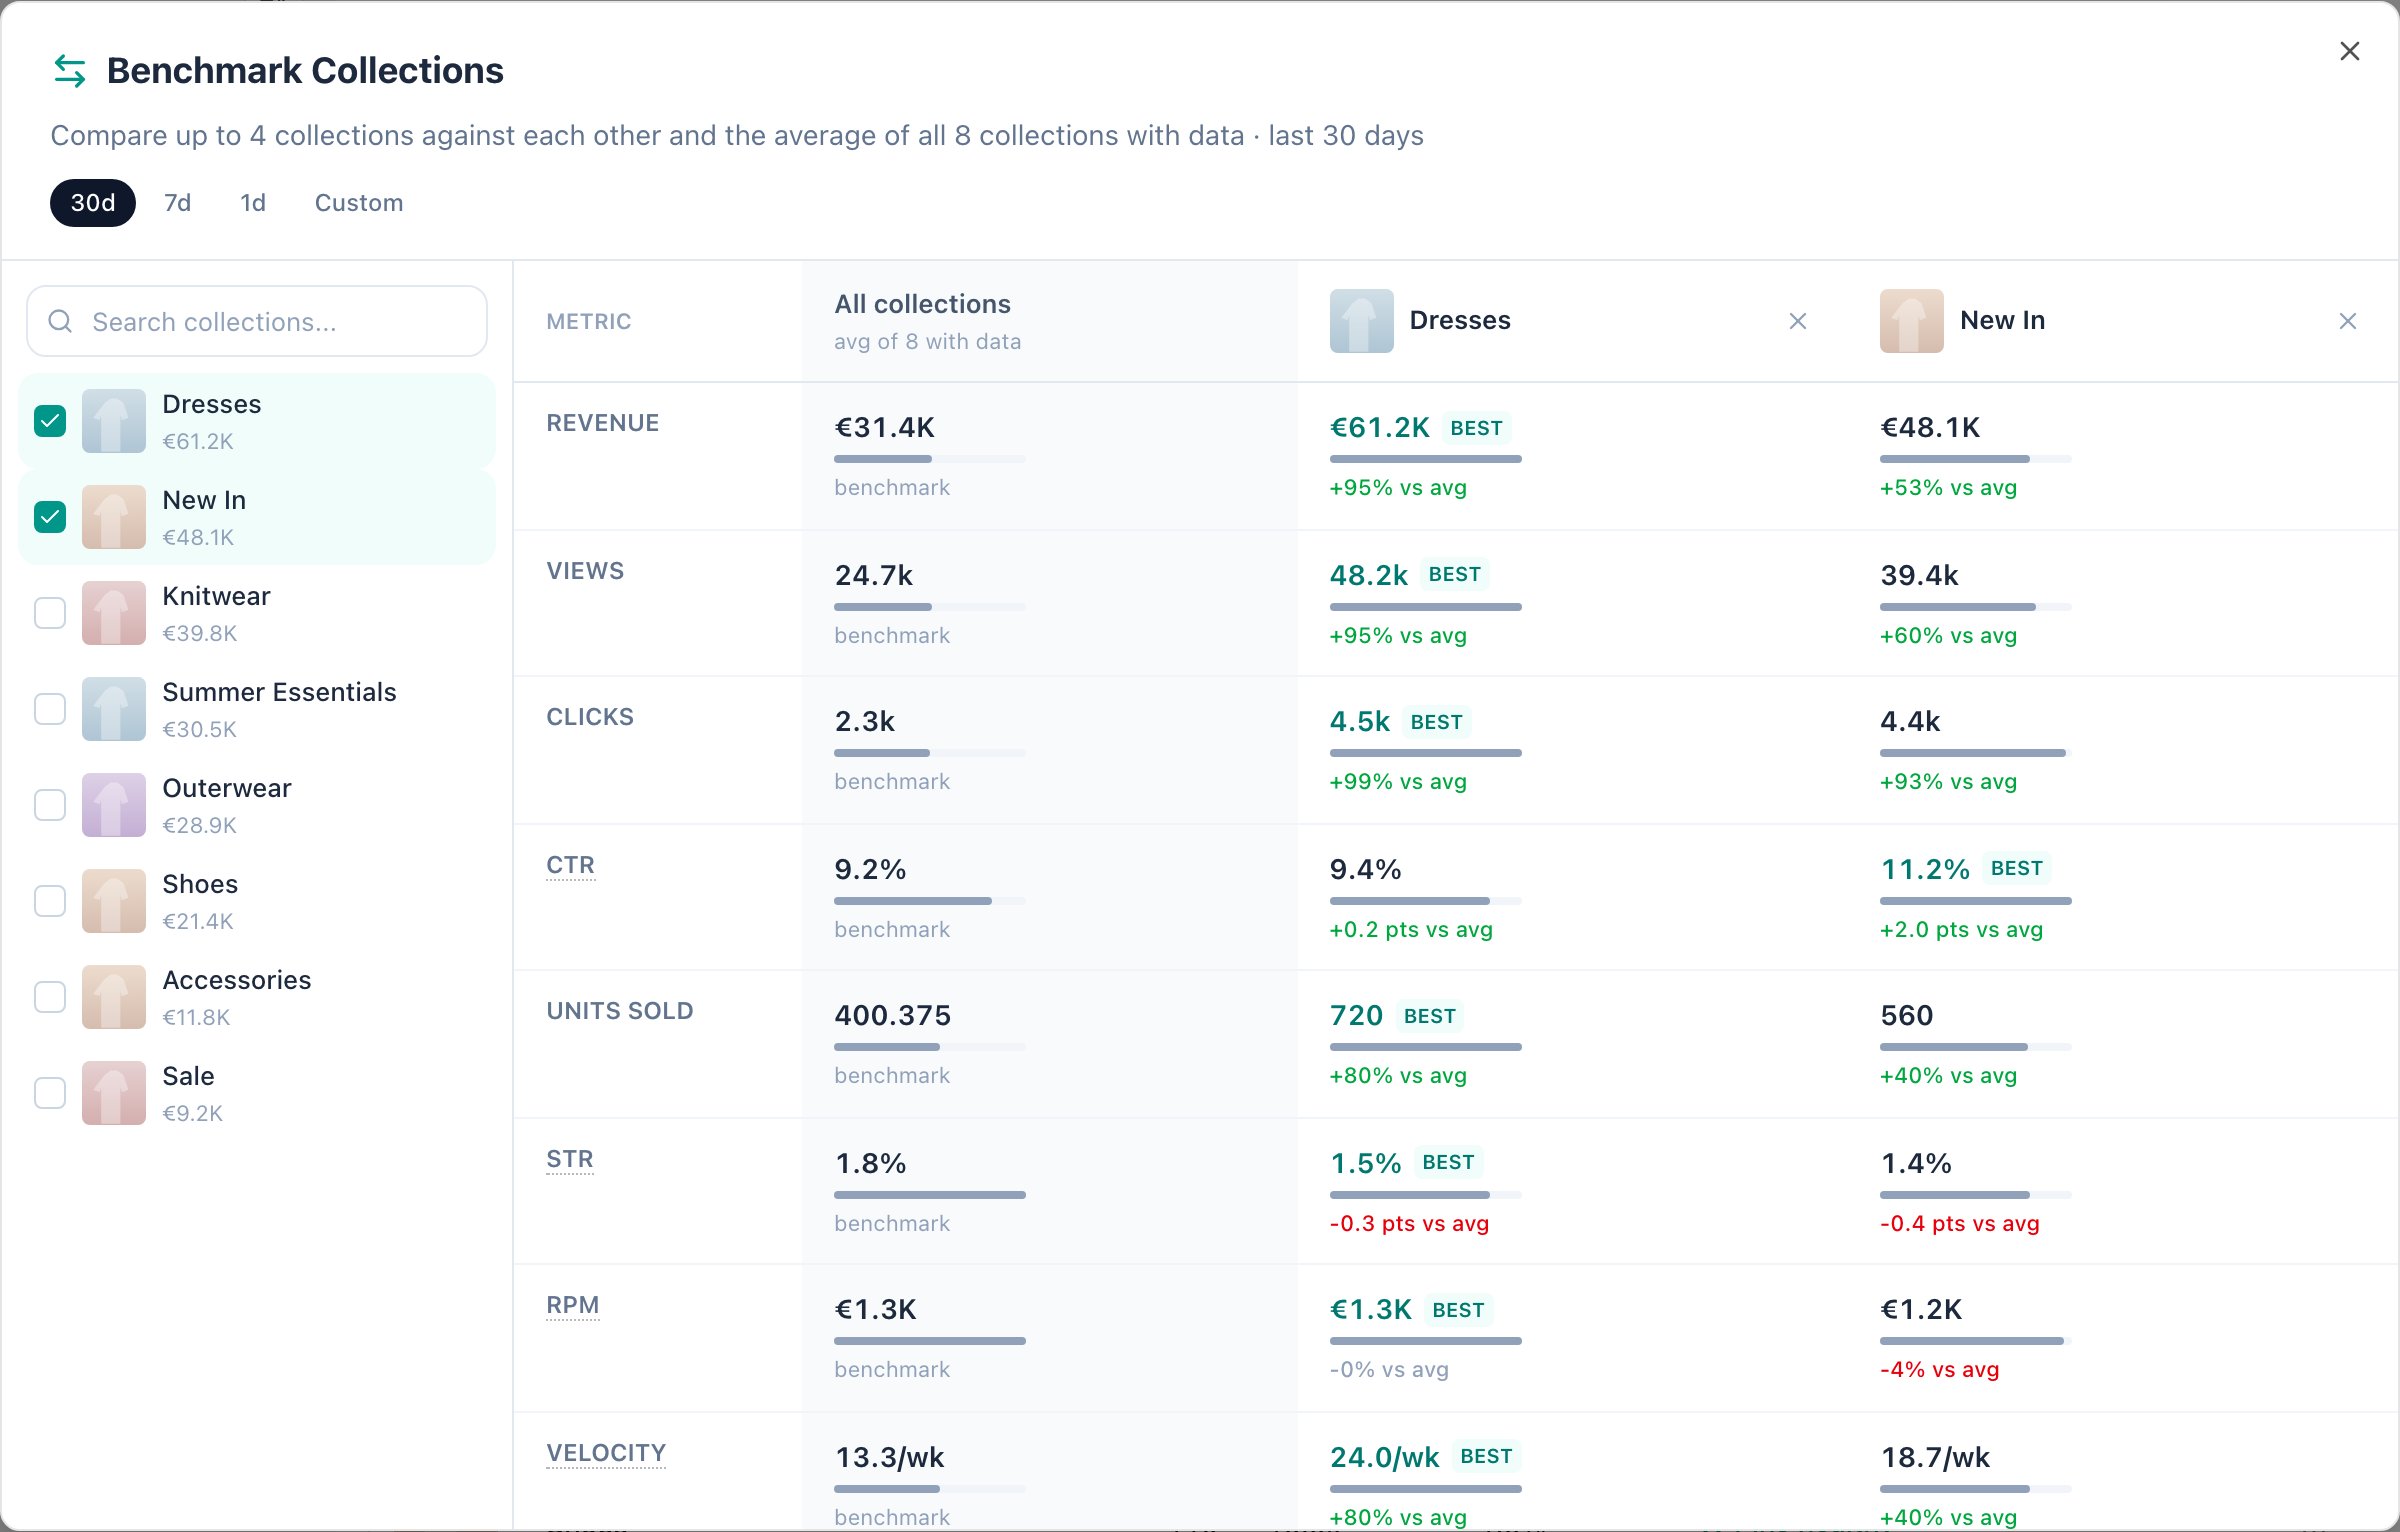
The **Benchmark** button opens a modal where you compare any set of
collections side by side — against each other and against the "All
collections" baseline — across revenue, traffic, engagement and inventory
metrics.
### Traffic & Engagement
A horizontal conversion funnel — impressions, clicks, add to cart (when
tracked) and purchases — with stage-to-stage conversion rates on the
connectors and previous-period trends under each stage. CTR is shown alongside
with its trend.
### Performance
Revenue, RPM (revenue per thousand impressions), views, CTR, units sold and
STR, each with previous-period deltas and clickable trend charts.
### Product health & inventory
* **Variant availability** — in-stock variants as a share of all variants in
the collection.
* **Inventory breakdown** — healthy / low / out-of-stock buckets, dead stock
count and average stock coverage in days.
### Top products
The best performers in the collection, with per-product CTR and STR.
## Pinned vs Auto
For collections with pinned products, Depict compares the CTR of your pinned
products against the auto-ranked ones and turns the result into a
recommendation:
* **Pins performing** — your pins outperform auto-ranking; leave them.
* **Check pins** — the difference is small or mixed; review individual pins.
* **Unpin advised** — auto-ranking outperforms your pins; consider unpinning.
The collections table shows this as a compact traffic-light status. The
drawer and the **Pinned vs Auto** modal break it down per product, with
relative CTR differences, per-product recommendations, one-click pin/unpin
actions and CSV export. An info tooltip explains how to read the numbers.
## Inventory and dead stock
**Dead stock** counts products with stock but effectively no sales in the
period — capital sitting still. **Average stock coverage** estimates how many
days current inventory lasts at the current sales rate. Both appear per
collection in the table (fused into one Inventory column) and aggregated in
the KPI row; the dead stock modal lists the specific products so you can act
on them.
## Benchmarking
The **Benchmark** button opens a modal where you compare any set of
collections side by side — against each other and against the "All
collections" baseline — across revenue, traffic, engagement and inventory
metrics.