> ## Documentation Index
> Fetch the complete documentation index at: https://docs.depict.ai/llms.txt
> Use this file to discover all available pages before exploring further.
# Product analytics
> The Product analytics page: per-product KPIs, the shopper funnel, daily trends, per-collection performance, and CSV export.
The **Product analytics** page (titled "Products" in the app) shows how a
single product performs across your store: headline KPIs, a shopper funnel,
daily trends, and the product's position and performance in every collection
that holds it.
## Limits and behavior
* Every metric is shown against the previous period of the same length; the
period is picked with the range selector (24H, 7D, 4W, 6M, 1Y, or custom).
* A date range can span at most 365 days.
* The market filter appears only for stores with multiple Shopify markets.
Selecting a market group includes all of its markets.
* Variant inventory per market group is shown only for stores with multiple
Shopify markets.
* Metrics begin at the point Depict started measuring them for the store;
earlier dates show no data.
## Finding a product
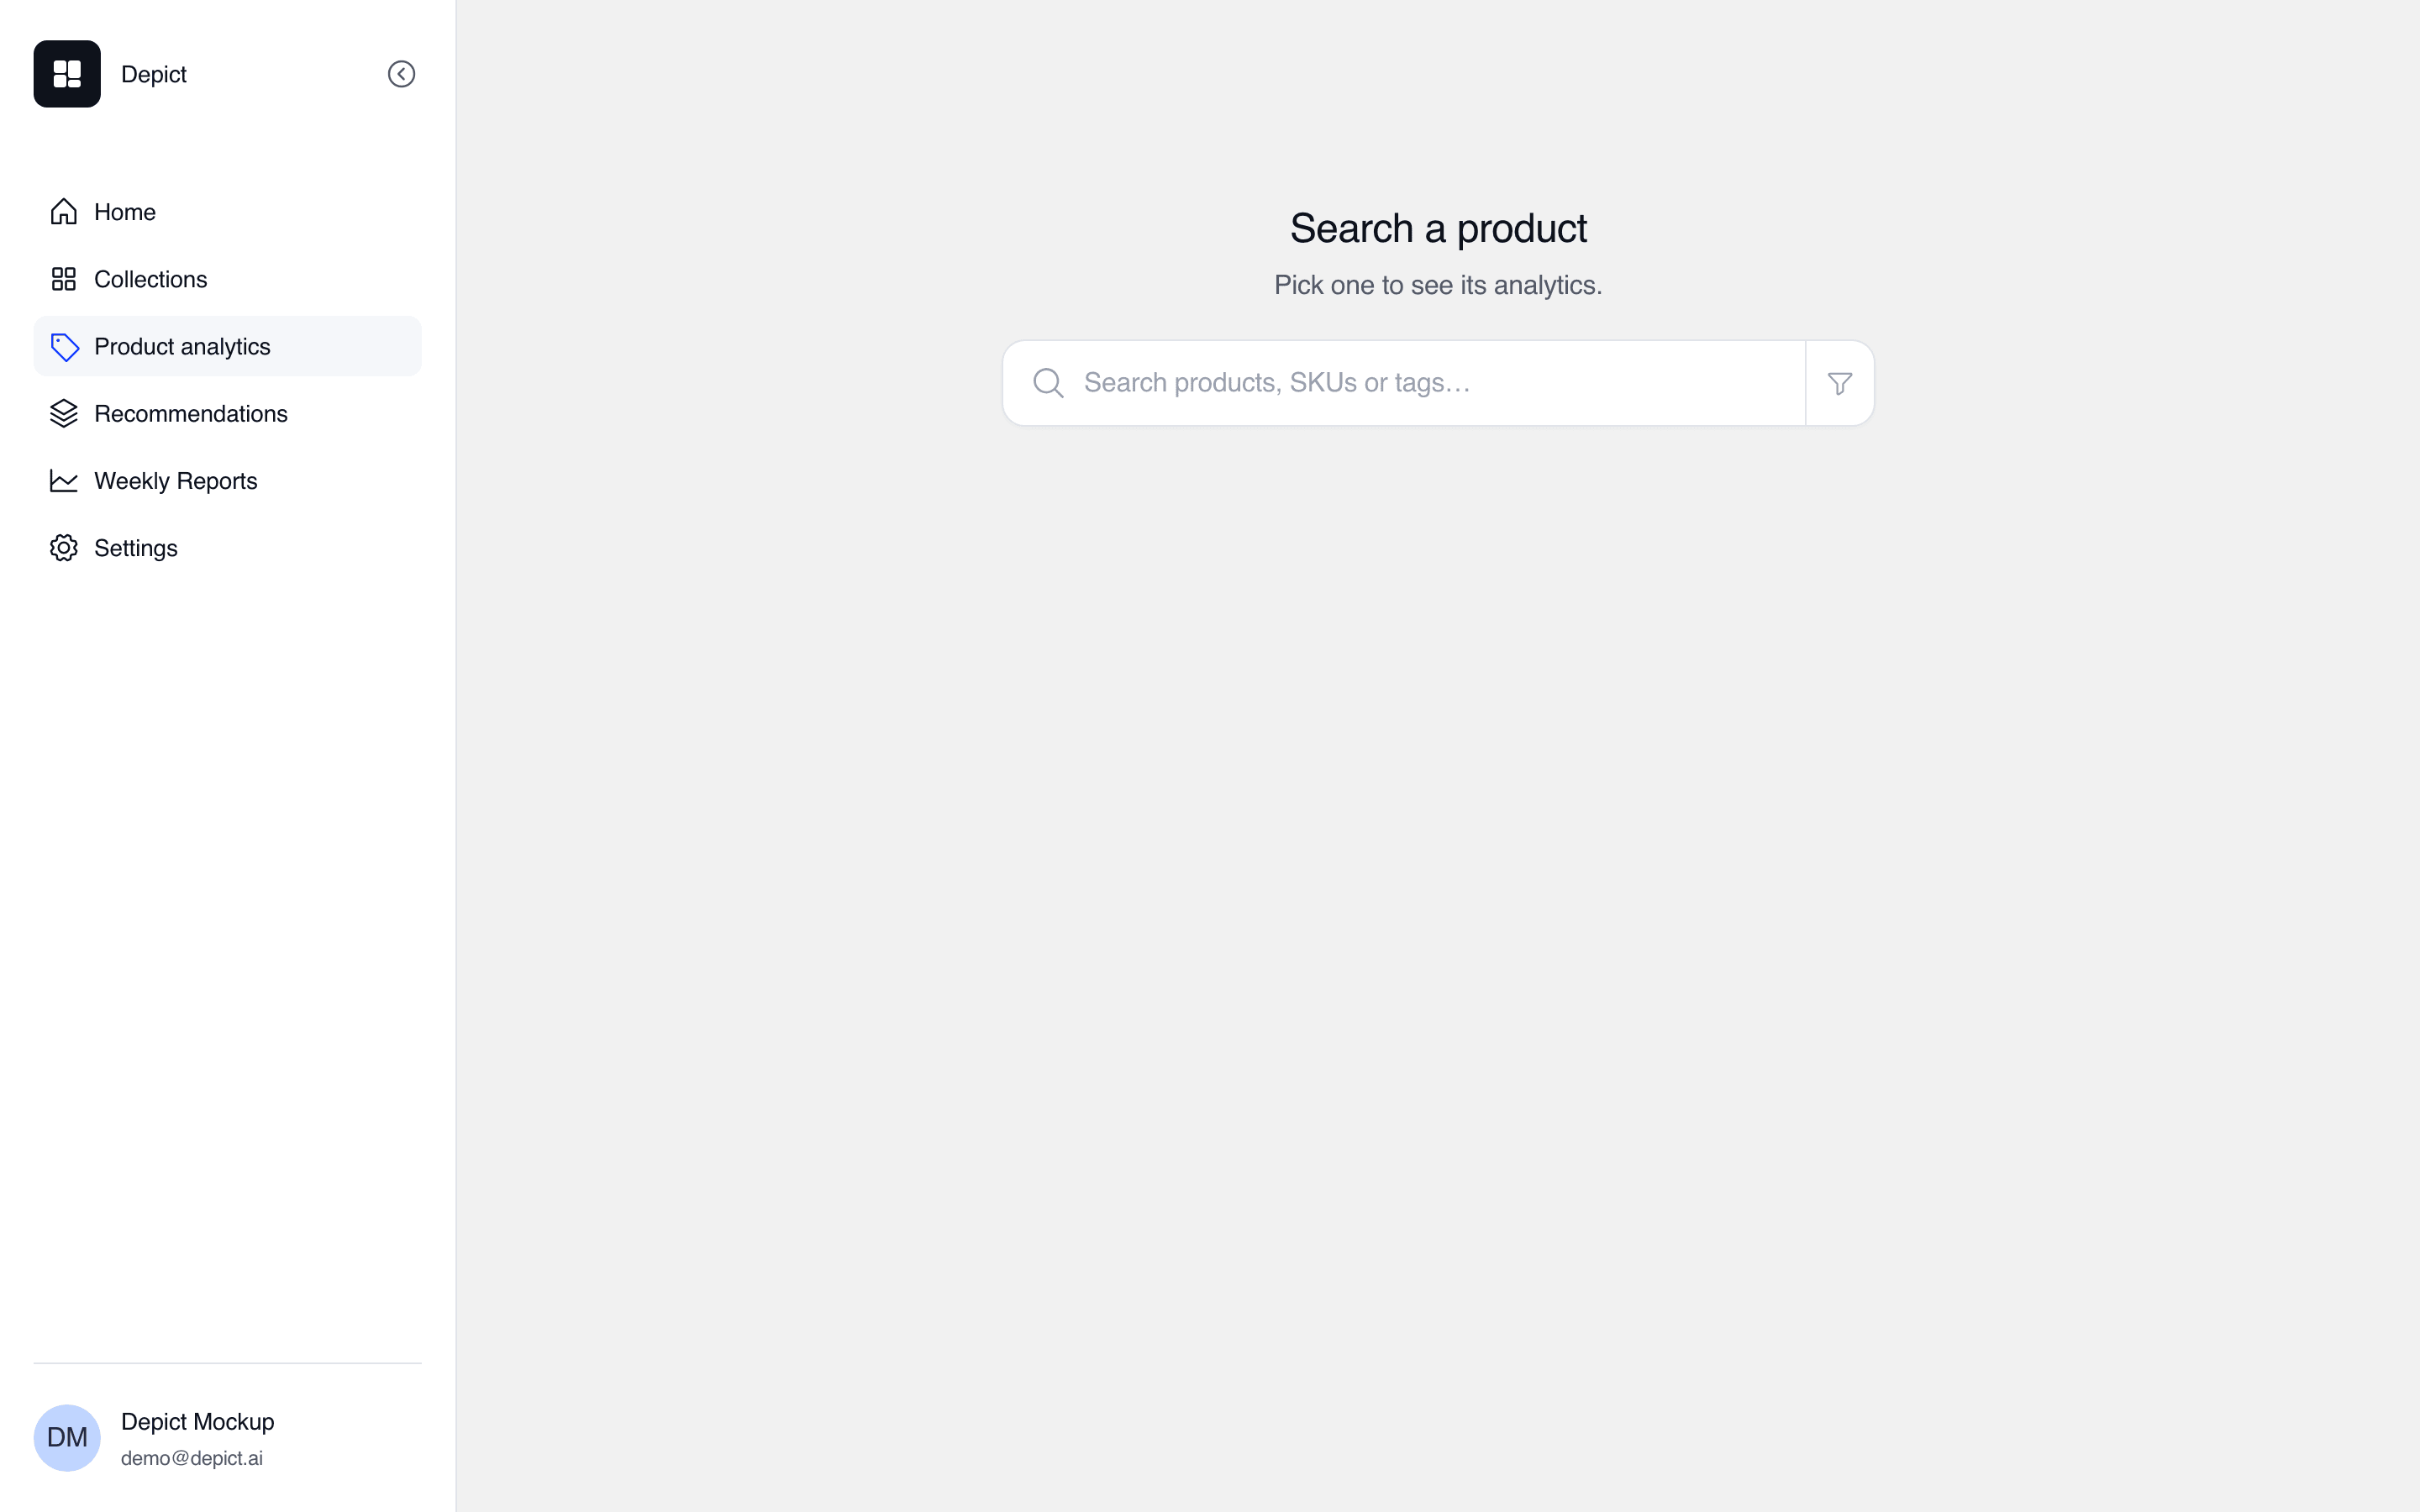 Search by product title, SKU or tag. The list can be scoped to a single
collection and sorted by collection order, search relevance, catalog order,
or performance (clicks, add-to-carts, orders, views, revenue). Recent
searches and recently viewed products are kept for quick access.
## The product view
Search by product title, SKU or tag. The list can be scoped to a single
collection and sorted by collection order, search relevance, catalog order,
or performance (clicks, add-to-carts, orders, views, revenue). Recent
searches and recently viewed products are kept for quick access.
## The product view
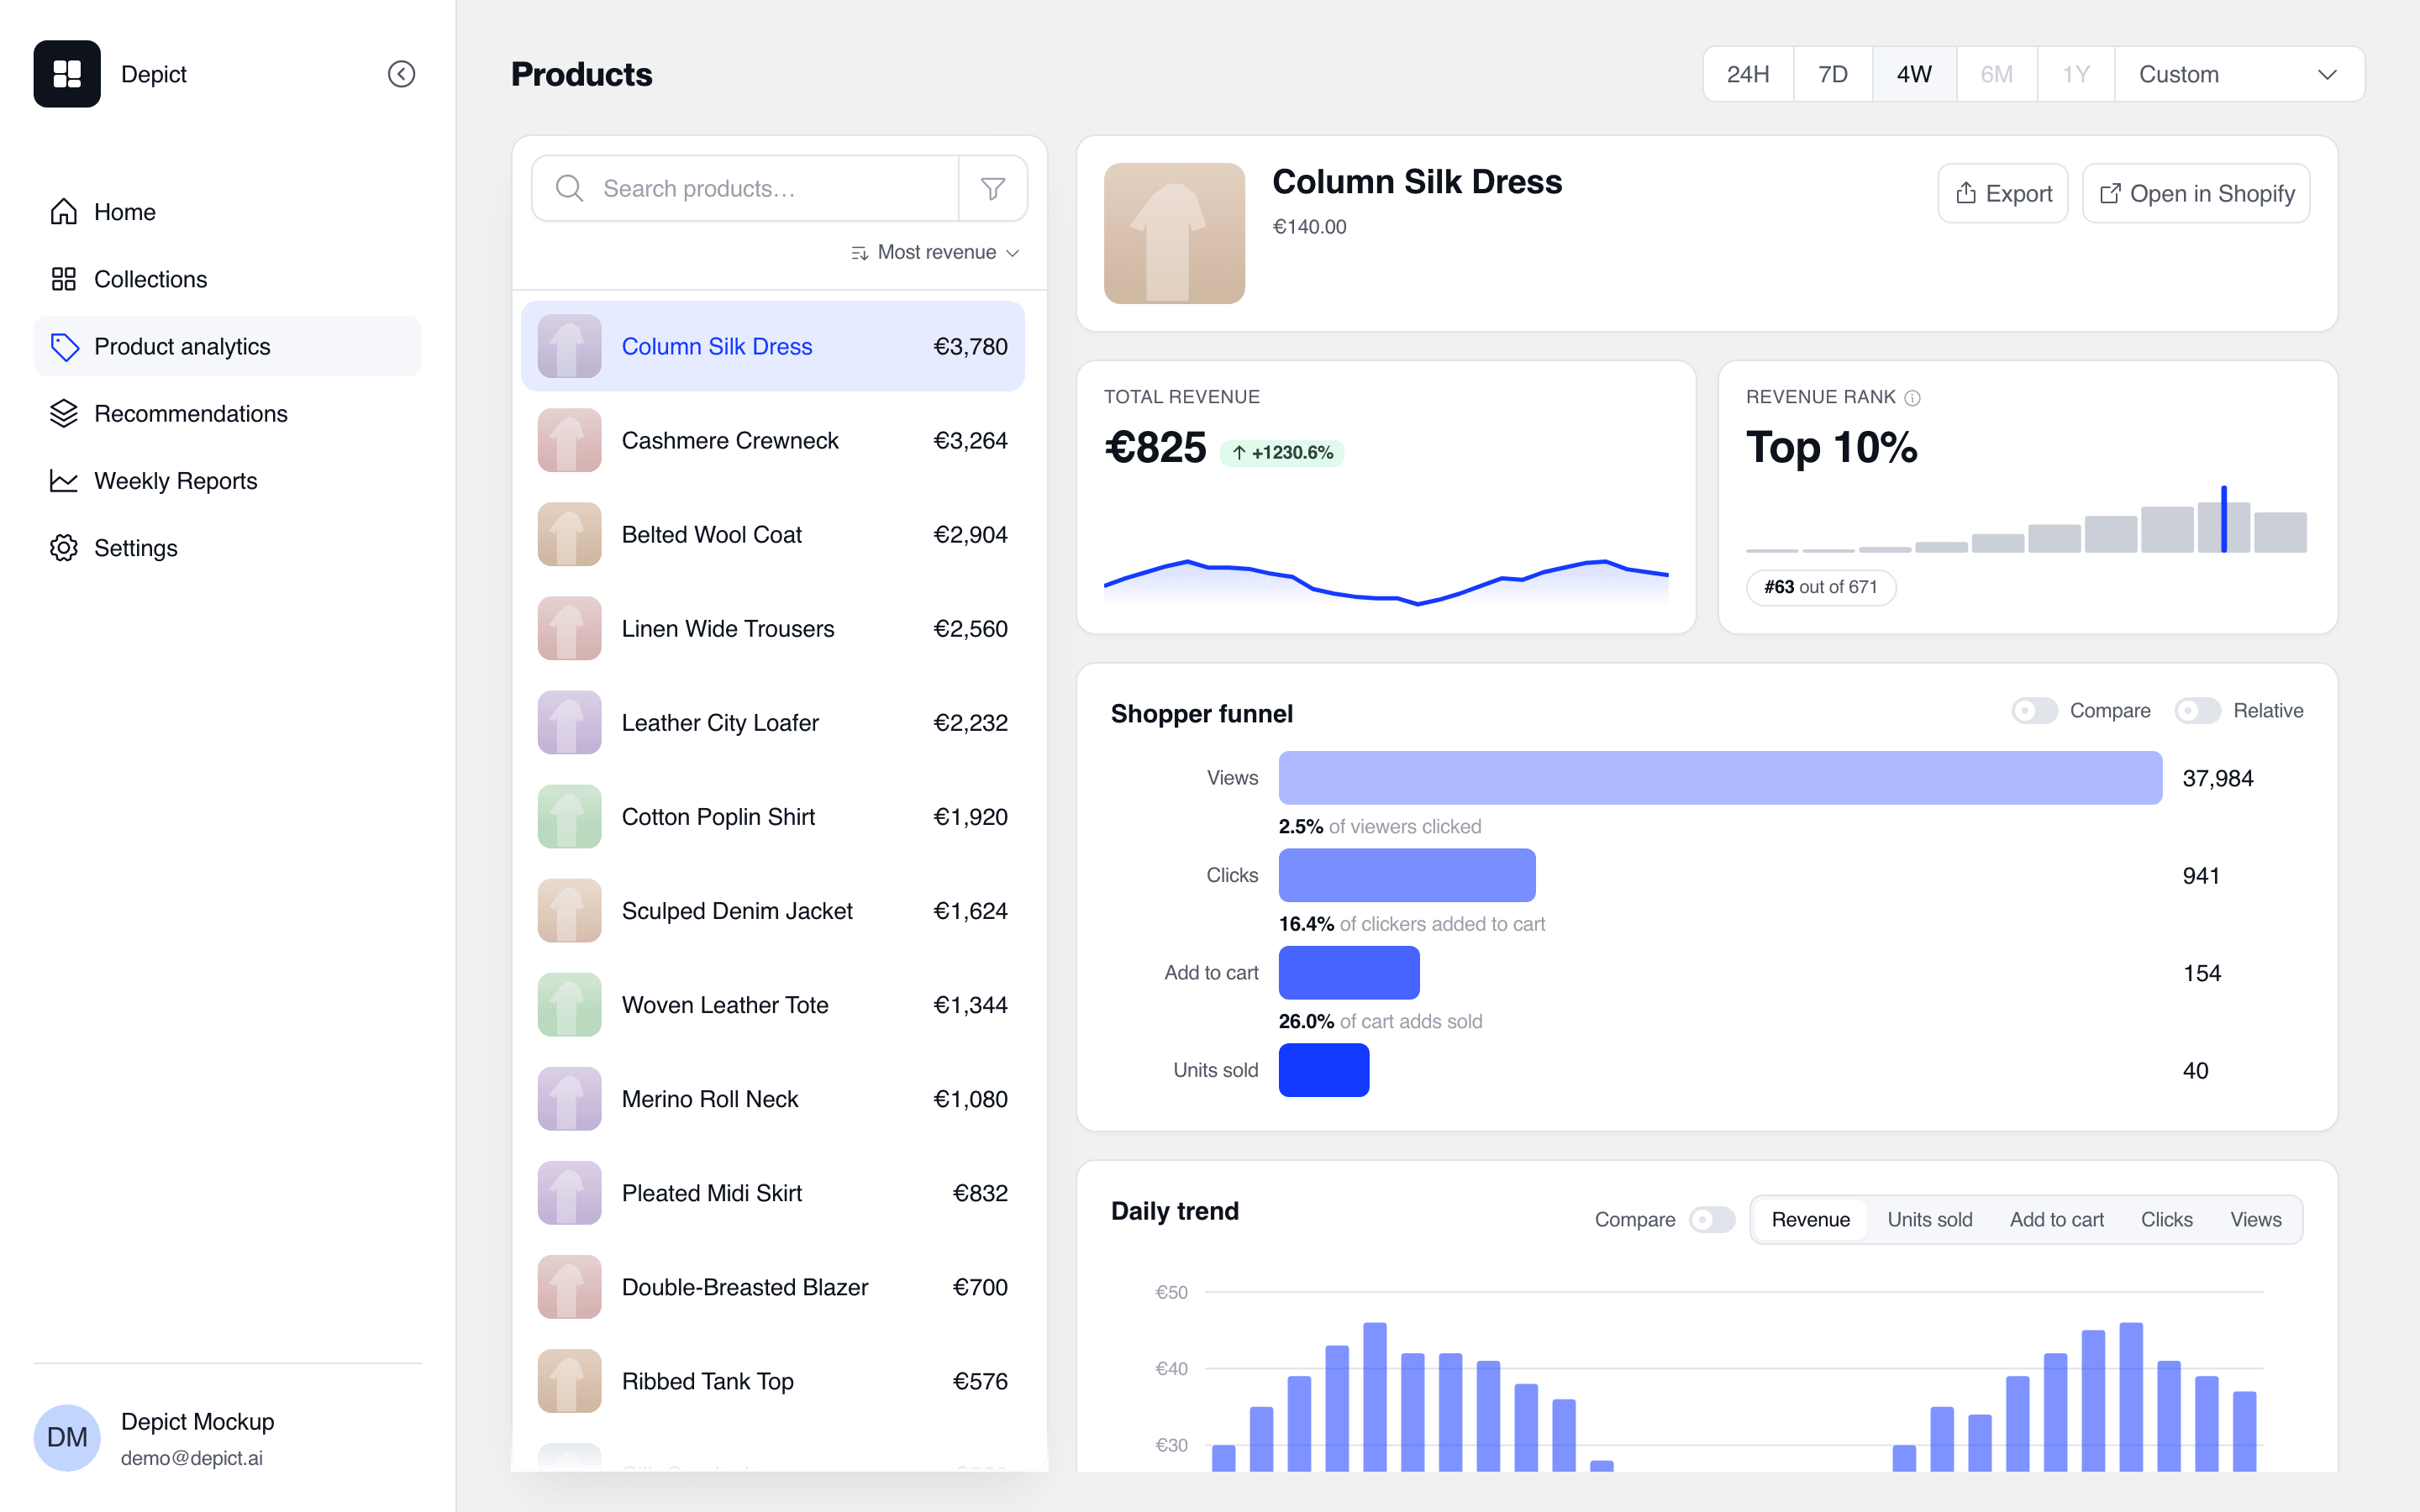 * **KPI tiles** — revenue, units sold, views, clicks, add-to-carts, and the
product's position, each with the change versus the previous period.
* **Revenue rank** — where the product sits in the store's revenue
distribution (for example "Top 10%, #63 out of 671"), with a histogram of
the full catalog.
* **Shopper funnel** — views → clicks → add-to-carts → units sold, with the
conversion rate between each stage. A compare toggle overlays the previous
period, and a relative toggle switches the bars to percentages.
* **Daily trend** — a per-day chart, switchable between revenue, units sold,
add-to-carts, clicks and views.
* **Collections table** — every collection holding the product, with the
product's position in it, plus views, clicks and CTR per collection.
Pinned and live indicators mark where the product is pinned and which
collections are live.
* **Variant inventory** — stock per variant, broken down per market group on
multi-market stores.
## Exporting
The **Export** action downloads the product's data as CSV, in five sections:
KPI summary, daily series, previous period, collections and positions, and
variant inventory.
* **KPI tiles** — revenue, units sold, views, clicks, add-to-carts, and the
product's position, each with the change versus the previous period.
* **Revenue rank** — where the product sits in the store's revenue
distribution (for example "Top 10%, #63 out of 671"), with a histogram of
the full catalog.
* **Shopper funnel** — views → clicks → add-to-carts → units sold, with the
conversion rate between each stage. A compare toggle overlays the previous
period, and a relative toggle switches the bars to percentages.
* **Daily trend** — a per-day chart, switchable between revenue, units sold,
add-to-carts, clicks and views.
* **Collections table** — every collection holding the product, with the
product's position in it, plus views, clicks and CTR per collection.
Pinned and live indicators mark where the product is pinned and which
collections are live.
* **Variant inventory** — stock per variant, broken down per market group on
multi-market stores.
## Exporting
The **Export** action downloads the product's data as CSV, in five sections:
KPI summary, daily series, previous period, collections and positions, and
variant inventory.