

Limits and behavior
- Every figure is shown against the previous period of the same length. The period is set with the period picker: 1D, 7D, 30D (the default) or Custom. Presets are whole days ending today.
- A custom range can span at most 365 days, and can’t start before Depict started measuring the store.
- The market filter appears only when you have enabled market groups (see Settings → Market groups). Selecting a group includes all of its markets.
- Stock per market group is shown only for stores with multiple Shopify markets.
- The page opens on the product you viewed last; the search view appears on your first visit.
Finding a product
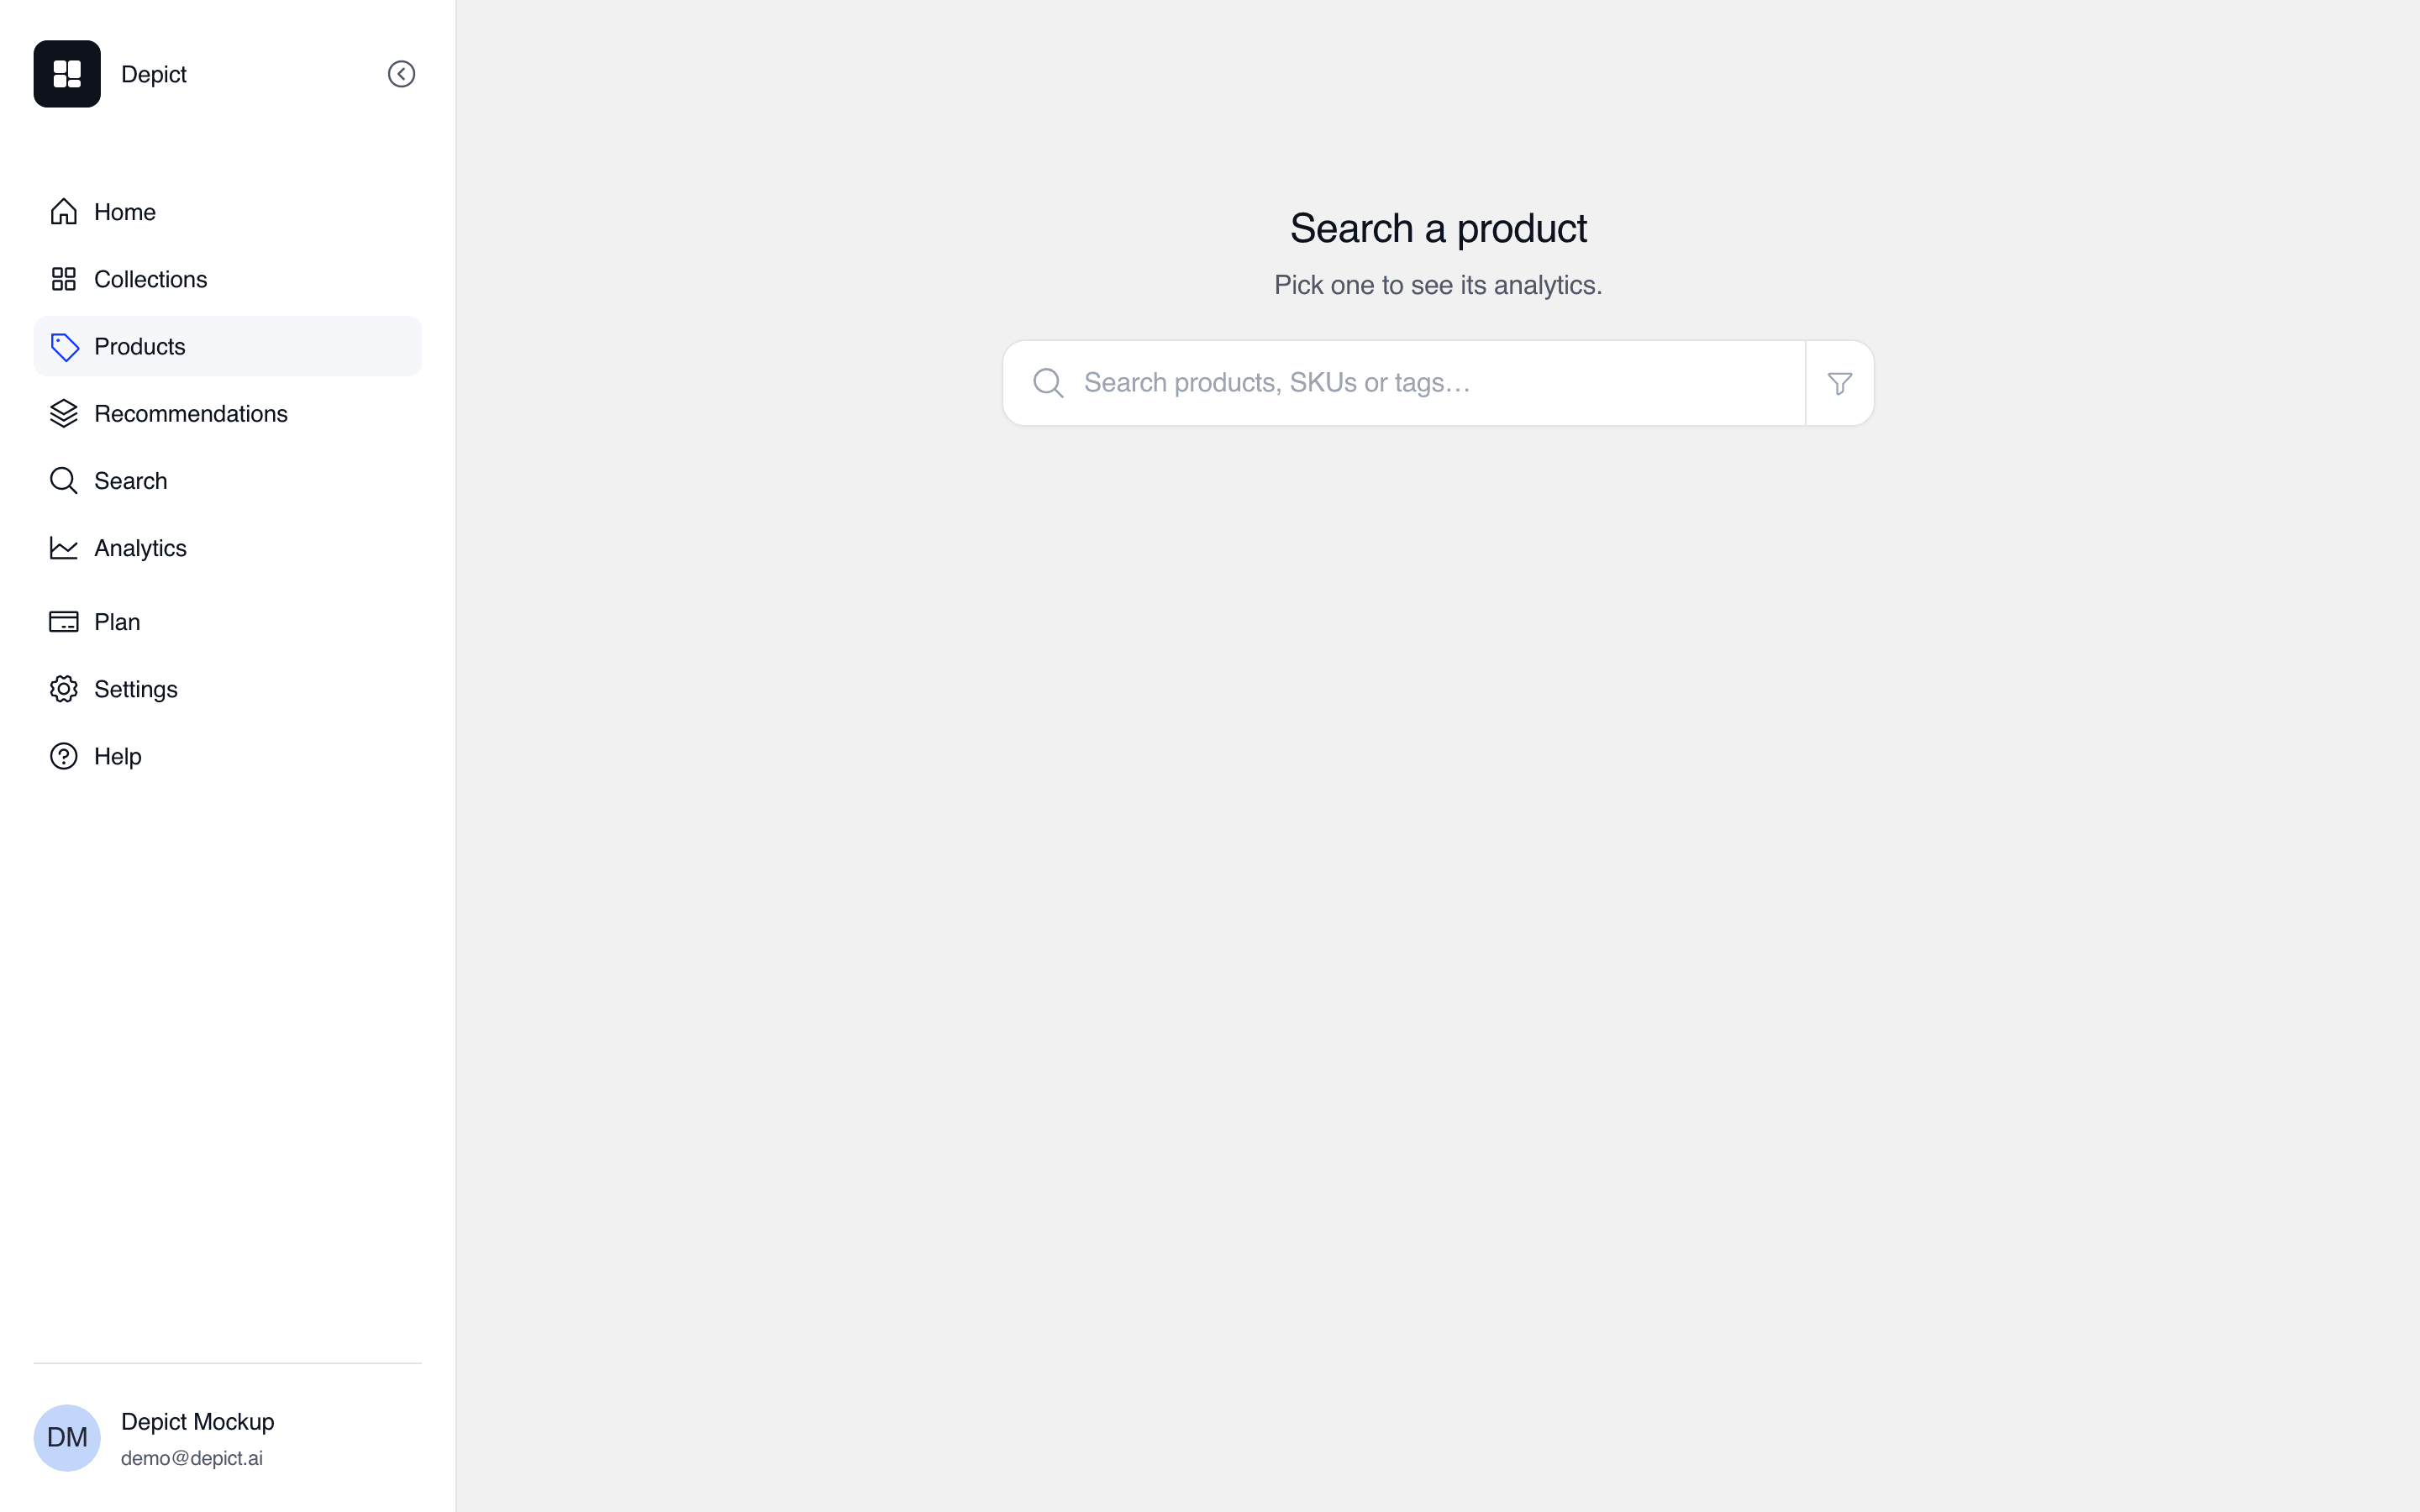
The search view: search by title, SKU or tag, with a collection filter.
- Performance over the selected period — Most revenue (the default), Most units sold, Most added to cart, Most clicked, Most viewed. With a collection selected, clicks and views count that collection only.
- Catalogue — Name: A to Z, or Collection order when a collection is selected.
The product view
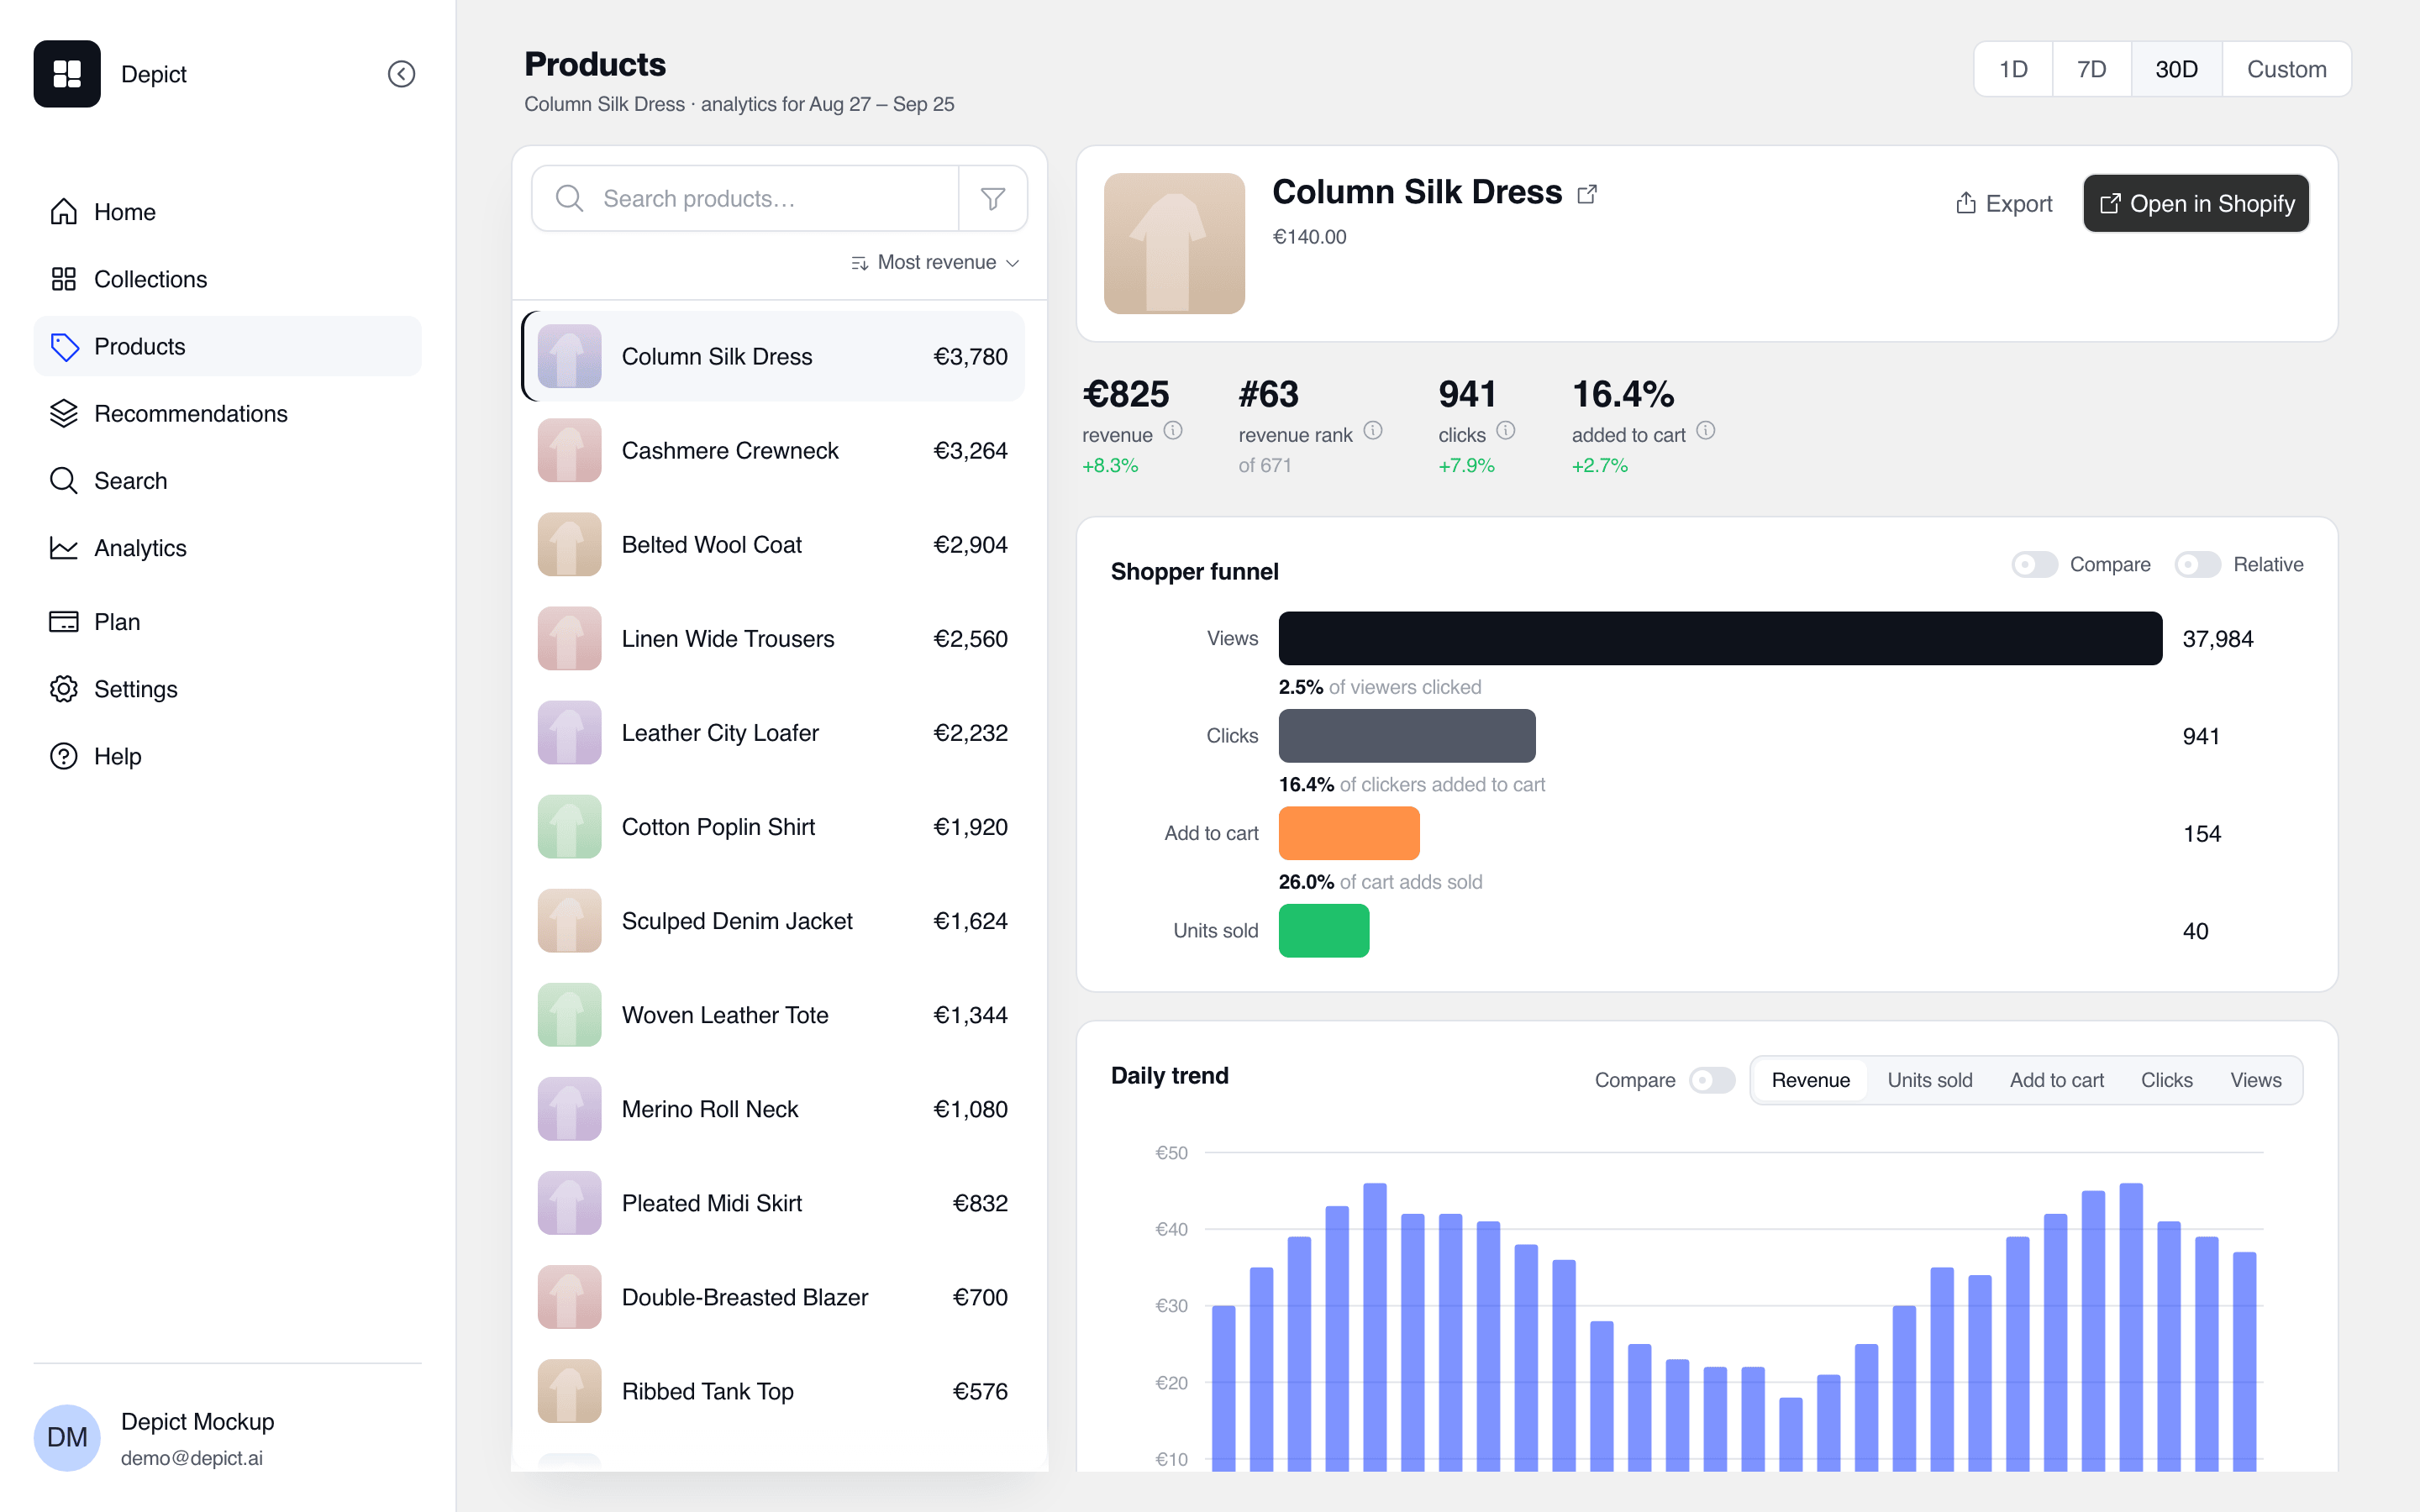
A product's view: revenue and revenue rank with the change versus the previous period, the shopper funnel, and the daily trend.
- Header — the product’s image, title, badges (such as bestseller, new in, trending or slow mover), variant count, price and tags, with the Export and Open in Shopify buttons.
-
Figures — each with an info tooltip and the change versus the previous
period:
- Shopper funnel — views → clicks → add to cart → units sold, with the conversion rate between each stage. Compare overlays the previous period; Relative shows each stage as a share of the largest.
- Daily trend — a per-day chart, switchable between revenue, units sold, add to cart, clicks and views. Clicks and views can be narrowed to a single collection. Compare adds the previous period.
- Collections — every collection holding the product, with the product’s position in it, plus views, clicks and CTR per collection. A pin marks collections where you pinned the product, and a green dot marks live ones. Relative shows positions as “n / N” and views and clicks as shares. Click a row to open that collection’s editor at the product.
- Inventory — stock per variant, for products with variants. Low stock is marked orange and sold-out variants red. On multi-market stores it follows the market filter, and shows a range across market groups when all markets are selected.
Exporting
The Export button downloads the product’s data as a CSV. Pick the sections to include:
The file always opens with the product’s title, ID, handle, status and the
exported period.