

Limits and behavior
- The period is set with the period picker: 1D, 7D, 30D (the default) or Custom. Presets are whole days ending today, and the selected period carries over to the other pages of the app.
- Every change percentage compares the selected period with the previous period of the same length.
- For the first 7 days after install, the page shows that it is collecting your first report data. Change percentages show a placeholder until a full previous period of data exists.
- CSV export includes up to 20,000 products; if more exist, the export stops there and says so.
Top products
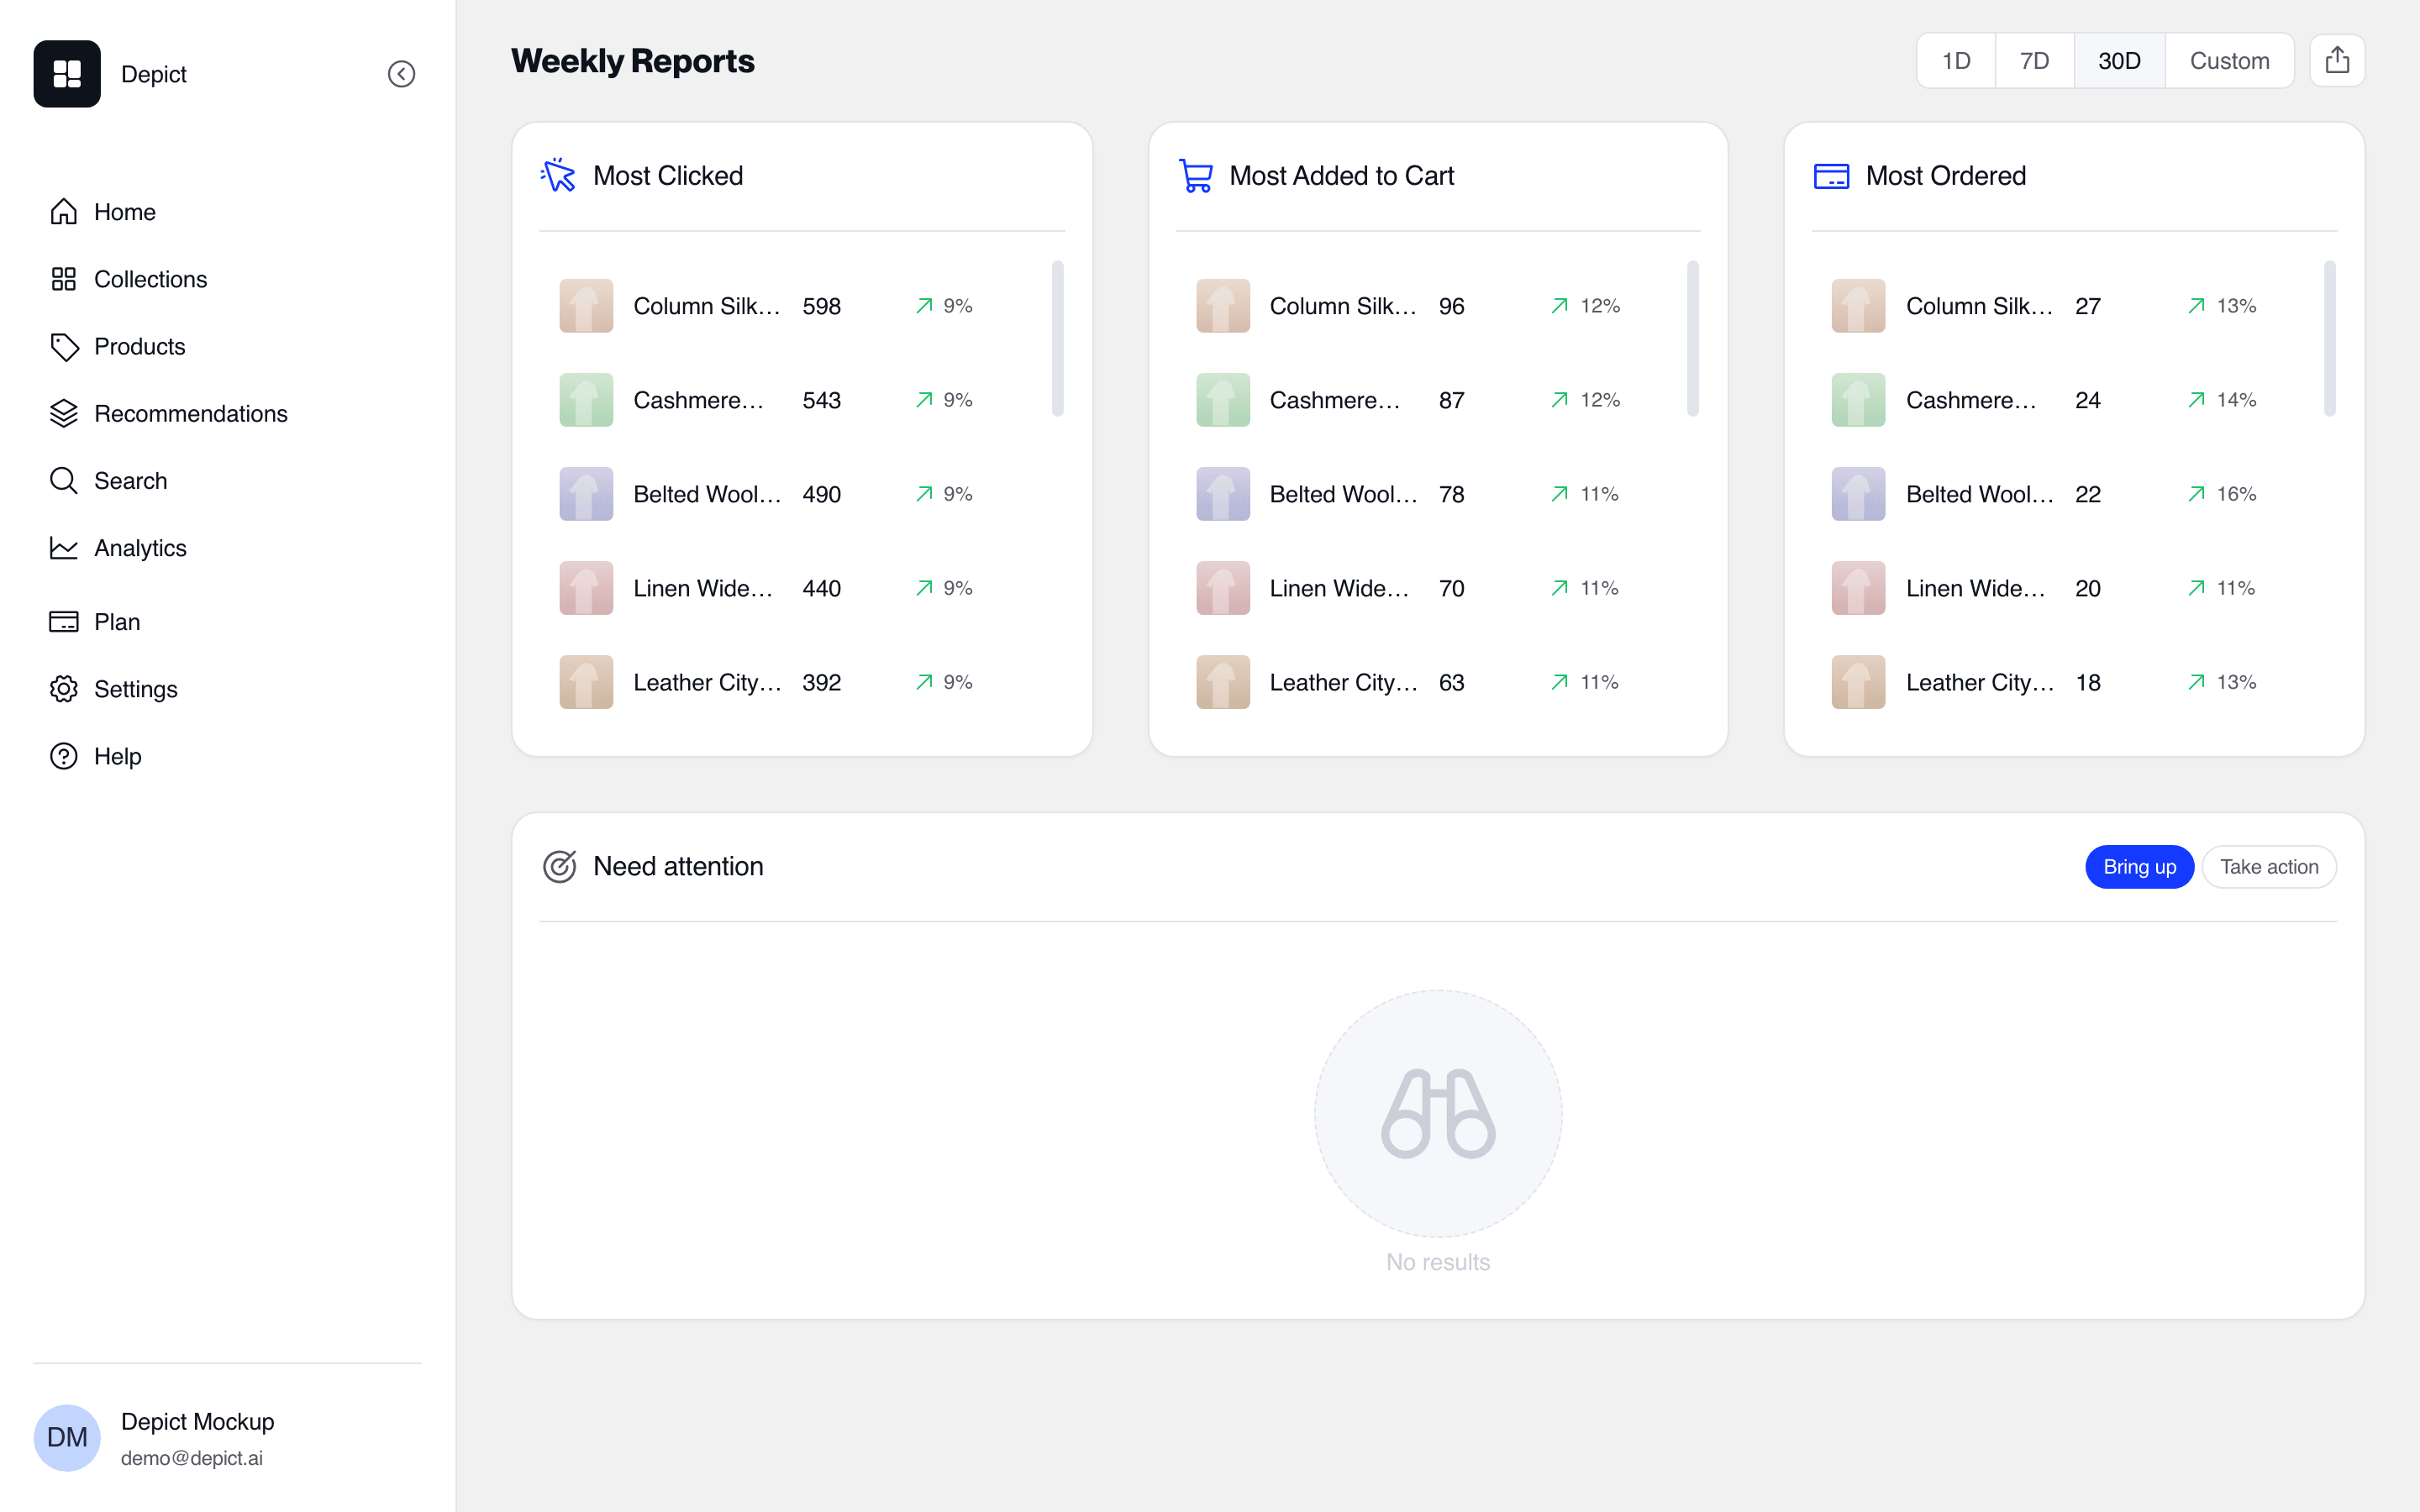
The report: the Most Clicked, Most Added to Cart and Most Ordered lists, and the Need attention section.
Each row shows the product’s count and its change versus the previous
period; hover the change to see the previous period’s count. The lists load
more products as you scroll, and a product’s title opens it on the
Products page.
Need attention
Two lists suggest concrete merchandising moves, switchable with the Bring up / Take action toggle (Bring up is shown first):
Each list shows up to 10 products with their Performance Score — the
product’s sales compared with the period’s best seller, on a 0–10 scale — and
their Position in the collection that put them on the list. Hover a
product for its clicks, adds to cart and orders; expand a row to see every
collection holding it, with the suggested move in each.
Only collections you merchandise count: Shopify’s automatic “All” collection
and collections holding almost the whole catalog are left out. Products that
can’t be added to cart are left off both lists, and when the period ends
today, out-of-stock products are hidden too.
Positions are changed in the collection editor
— pin the product or adjust the sort order.
The Needs attention card on the Home page uses the same rules, but shows
only the Bring up list, for the latest full Monday–Sunday week.